If you would like to know more about GNSS satellites and weather observation, the presented interactive tools in four languages (in German, English, French, and Italian) provide you a great opportunity.
Interested in more details? Here is a brief introduction that should help you to understand what these tools are for.
Objective:
GNSS (Global Navigation Satellite Systems) basic objective is the precise positioning in real or near real time. However, GNSS data have proved to be useful in many applications such as precise monitoring of continental plate movements, snow depth and soil moisture determination, and atmospheric sounding. In this project, we are interested in estimating the path delay of the GNSS signal, which is then used to provide accurate estimates of the precipitable water vapor (PWV) in the atmosphere.
Data:
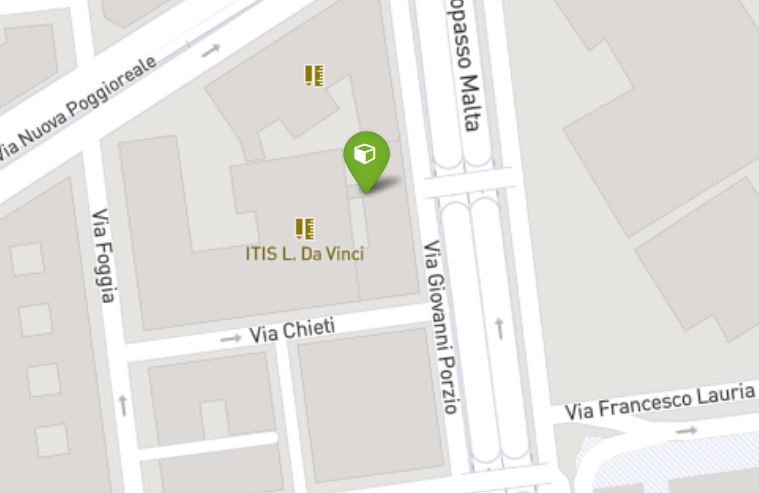
Within the project three integrated antenna stations were installed on school roofs in Germany, France, and Italy (panel A). The station names are acronyms and stand for Track Atmosphere Deutschland (TAD3), France (TAF1), and Italy (TAI1). We also can use data from other GNSS stations worldwide. There is a dense GNSS network in Germany as the map of panel F shows.
Display:
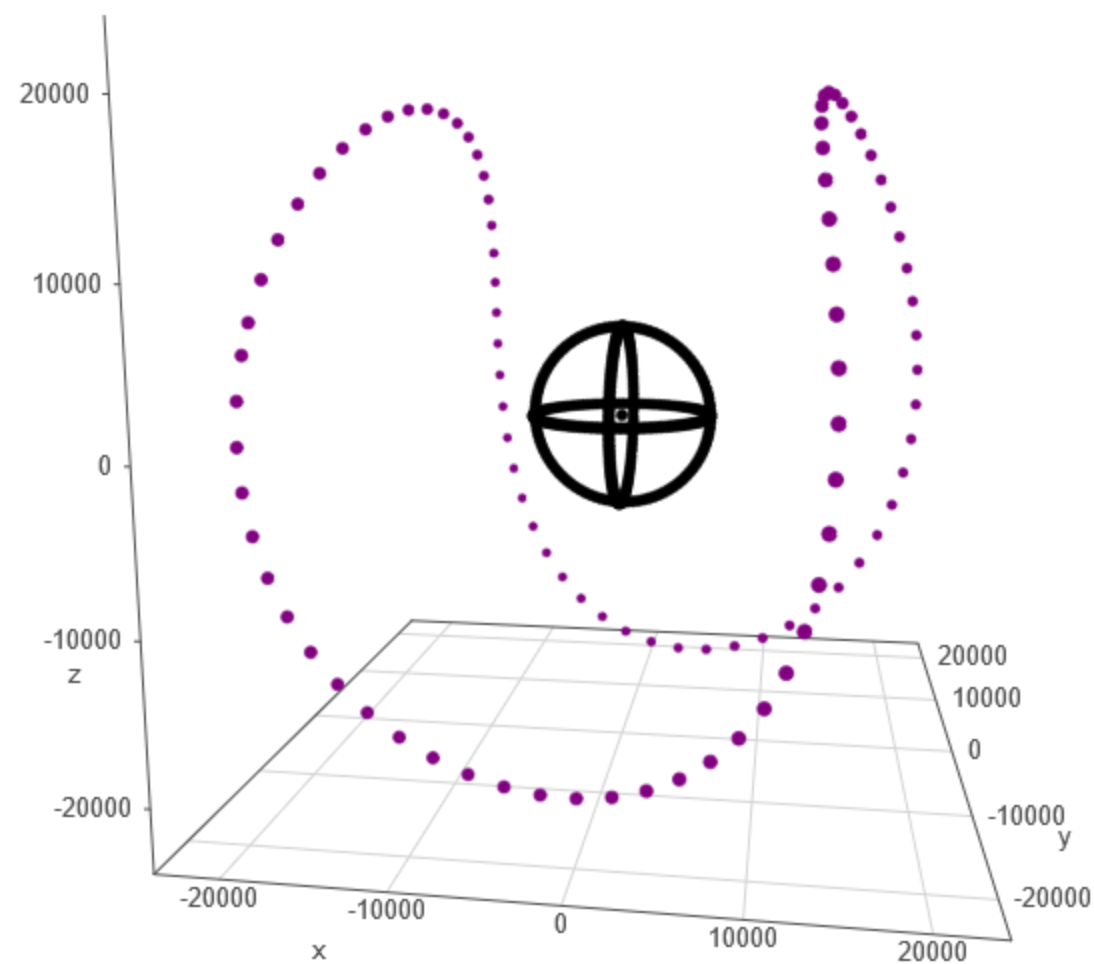
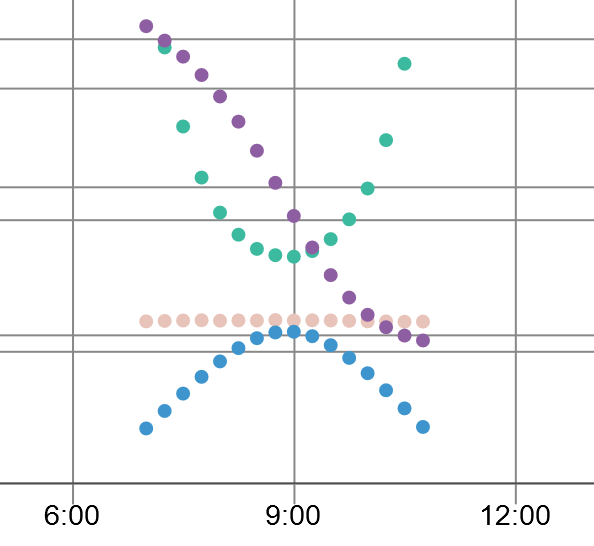
In order to estimate the signal path delay, we need the satellite precise position (X, Y, Z). By clicking on panel B, the coordinates of, for example, 24 GPS satellites can be explored. By clicking on panel C you can visualize time series of the data of a specific receiving station. The data include variations of the azimuth and elevation angles with respect to a specific satellite, and the slant and zenith path delays.
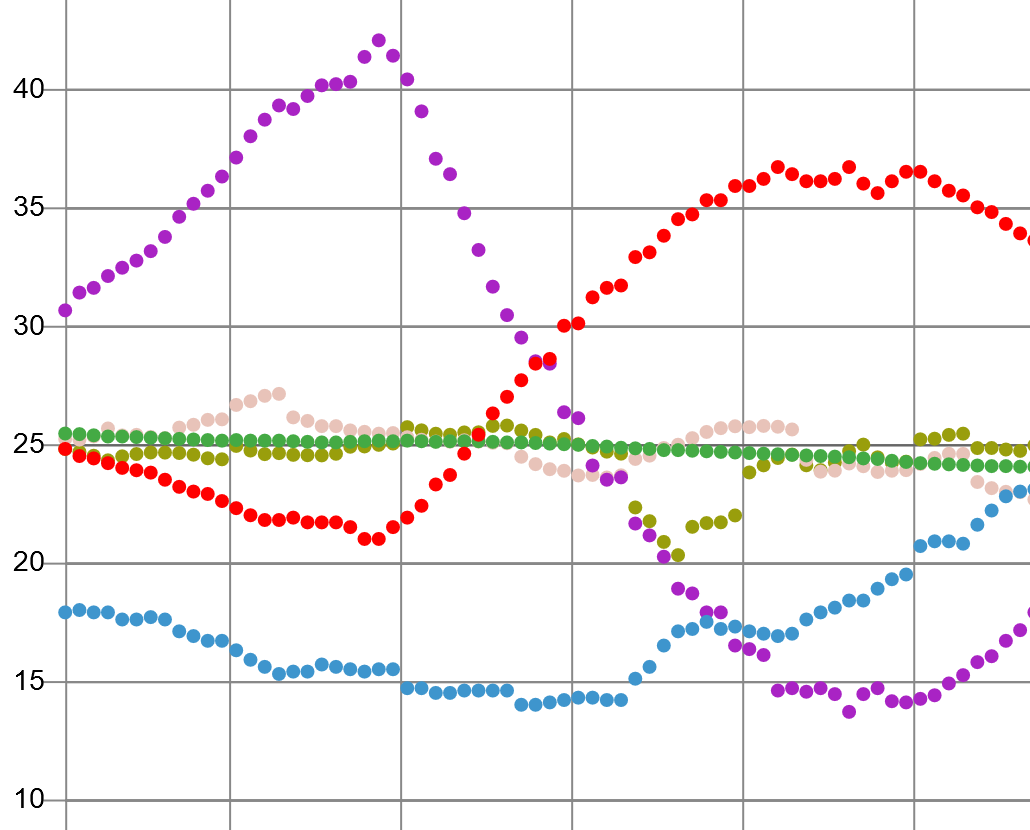
To show time series of atmospheric parameters: PWV, pressure, and temperature, click on panel D. By clicking panel E, you can also select a station and show all data with the corresponding satellite. This include the elevation, azimuth angles, the slant path delay, and the zenith delay.
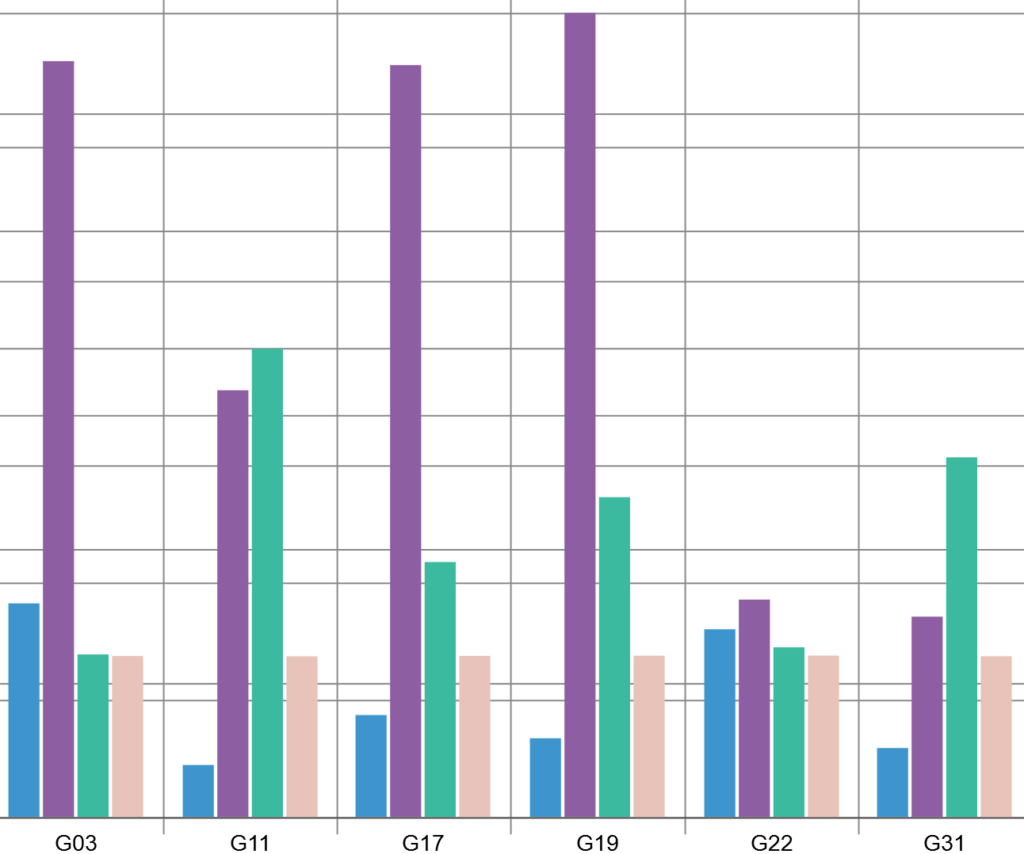
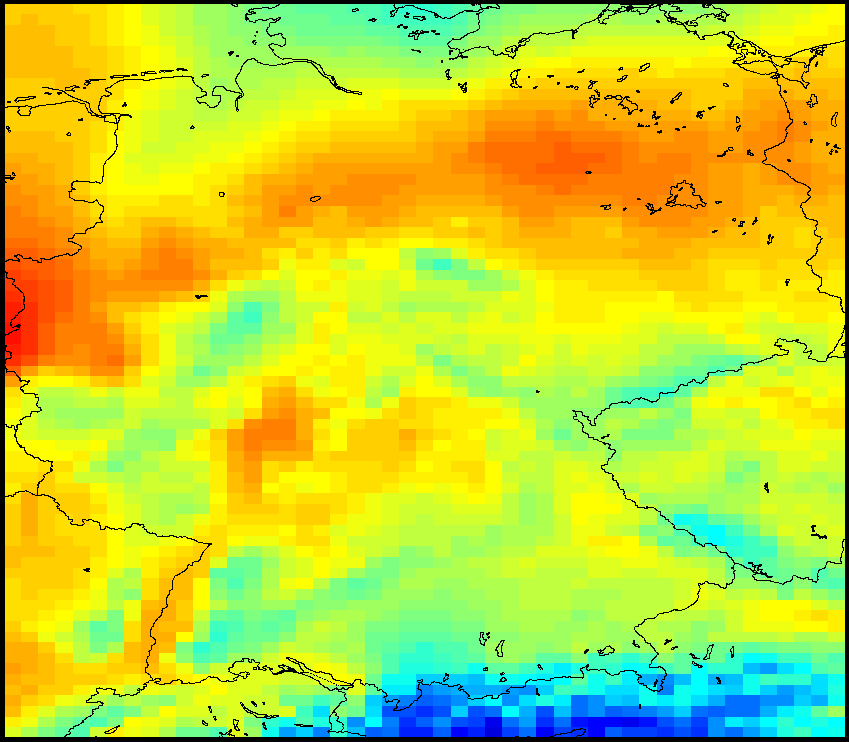
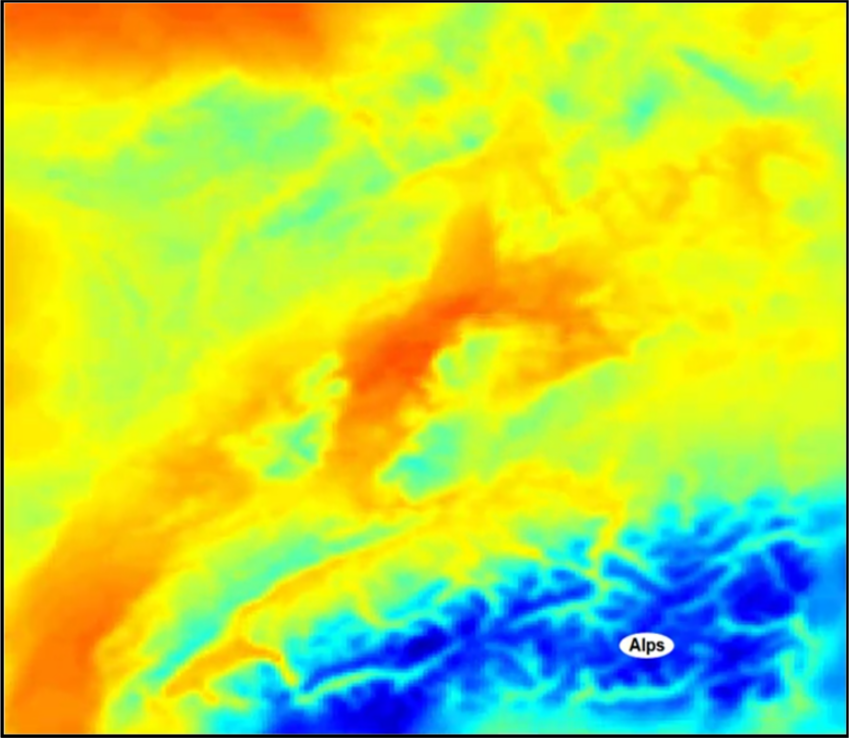
To show the PWV from the entire network for a specific time, click panel F. This network can be used to obtain a map of PWV every 15 minutes. An example for a time sequence of GNSS-based PWV maps interpolated at a spatial resolution of 12 km is shown in panel G. We can also run atmospheric models to produce PWV grids at a 3 km spatial resolution as seen in panel H.
For further details, please refer to the manuscripts/videos under the menu LEARNING MATERIALS. Should you have any further questions, do not hesitate to contact us.